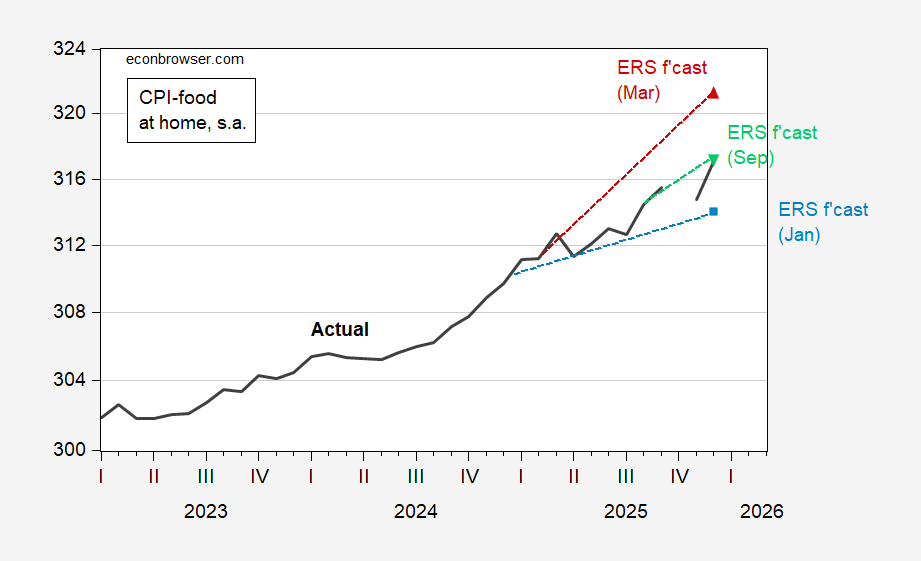
Reported hits the September USDA Economic Research Service forecast. Figure 1 displays the food-at-home component of the CPI, along with ERS forecasts:

Figure 1: CPI-food at home (bold black), January 2025 forecats (light blue square), March forecast (red triangle), and September (inverted light green triangle), all s.a. Source: BLS via FRED, ERS, and author’s calculations.
Given the distortions in the reported CPI arising from the government shutdown, one shouldn’t overstress the month-on-month figures. Looking over the longer term, grocery prices rose 2.4% y/y through December 2025. In contrast, they rose only 1.7% y/y through December 2024. So much for bringing down grocery prices.
September 2025 was the last ERS forecast, given the government shutdown and lapse in data collection. USDA indicates forecasts will resume publication on 1/22/2026.
I add one more graph of a component of food of particular interest to me: coffee!
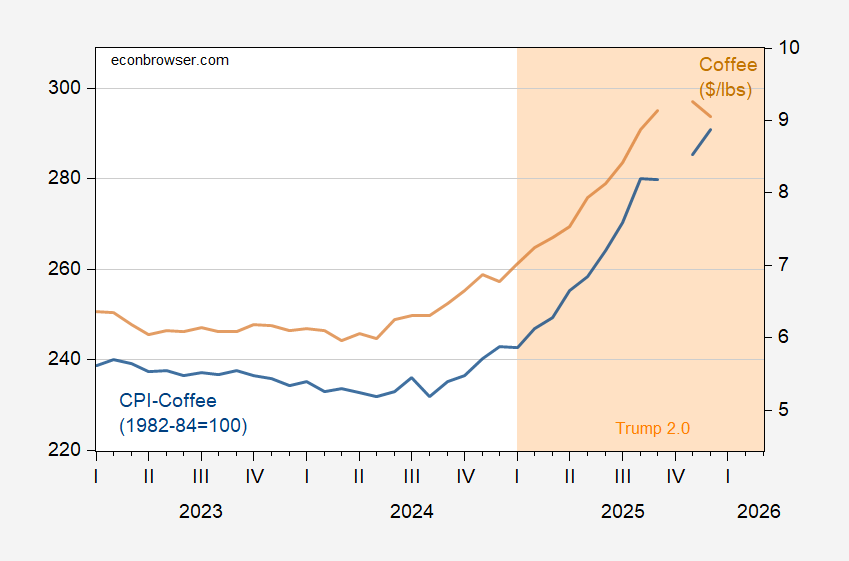
Figure 2: CPI – coffee (blue, left log scale), and coffee price per pound in $ (tan, right log scale), both s.a. Source: BLS via FRED.